

Introduction:
Among the optical investigation methods widely adopted in the field of conservation and restoration, photographic documentation stands out as a prevalent technique. This method relies on visual observation, which inherently imposes certain limitations on the accuracy of information acquisition. Factors such as shooting conditions, development processes, and equipment selection can significantly influence the recording outcomes. Nevertheless, considering its low implementation cost, the utility of the information obtained and its technical versatility are high, making it an effective practical investigation tool on-site.
On the other hand, interpreting material responses across various wavelength regions—such as visible light, ultraviolet, and infrared—requires specialized knowledge and experience. These judgments tend to be influenced by the investigator’s subjectivity. Although numerous prior studies and resources have documented the reaction characteristics of painting materials under different lighting conditions, it remains challenging to refer to these resources promptly during field investigations.
This study attempts to address these challenges by developing a reaction characteristics chart that systematically organizes the response characteristics of painting materials across different wavelength regions into textual and color information. Unlike traditional integrated structures, this chart features a modular design that allows users to rearrange components, enabling flexible indicator settings tailored to specific investigation objectives.
This paper reports on the development background, creation process, and practical applicability of the chart.
Background
The collection of photographic data for this study was based on a paper published in Issue No. 8 (1996) of the annual restoration journal issued by the Opificio delle Pietre Dure in Florence. The paper, authored by A. Aldrovandi et al., focused on the creation of color sample specimens of painting materials intended for optical investigation purposes.
dgeric.cultura.gov.it
Referencing this prior study, we faithfully reproduced 500 types of color sample specimens, including oil paints, egg tempera paints, and restoration materials, and applied a portion of these samples to actual photographic investigations. The imaging techniques employed encompassed seven types commonly used in conservation and restoration fields: visible light (color/monochrome), ultraviolet fluorescence (color/monochrome), ultraviolet reflectance, infrared reflectance, and false-color infrared imaging.
From the acquired image data, color information and grayscale values for each sample were extracted and incorporated as background colors in the Reaction Characteristics Chart. Additionally, the intensity of ultraviolet fluorescence reactions and the degree of infrared transmission or absorption were symbolically represented and organized. These data were compared and adjusted against existing data documented in previous literature , and each component was reconstructed as an independent piece.
The Reaction Characteristics chart proposed in this paper comprises 357 combinations from photographing 51 oil paint colors using seven different methods, and 336 combinations from photographing 48 egg tempera colors with the same methods, totaling 693 combinations. Mixtures, layered configurations, and restoration materials are excluded.

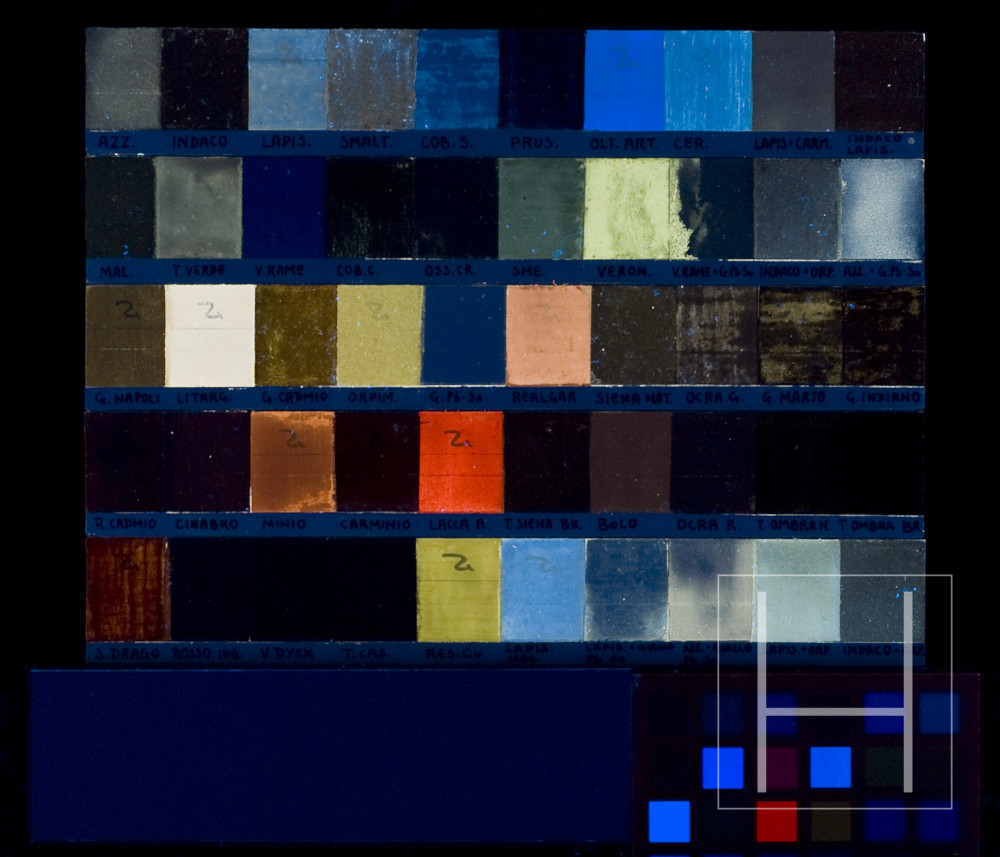


Figure 1. Photographic Images of Color Sample Specimens
This reference image visualizes and records the response information of the created color sample specimens (a subset: oil paint section) across different wavelength bands using equipment sensitive to ultraviolet and infrared radiation. By comparing images captured under visible light, ultraviolet fluorescence, ultraviolet reflectance, infrared reflectance, and false-color infrared imaging, it becomes possible to visually comprehend the characteristics and reactions of each pigment composed of multiple materials.
Note: While the original photographic data at the time of publication were collected using silver halide film, this reference image was newly captured after the publication of this paper using a digital camera compatible with infrared and ultraviolet regions. Details of the shooting conditions are provided in the table below^1. Although slight differences were observed due to variations in equipment and recording media, the overall results exhibited consistent trends.
| Imaging Type | Film Used | Applied Filter | Light Source |
| visible light | Kodak E100G Kodak T-max 100 | N/F* (Day light 4900 K) N/F* (Day light 4900 K) | Profoto Pro 5 PB head 1500W: x2 |
| Ultraviolet Fluorescence | Kodak E100G Kodak T-max 400 | Kodak Wratten No.2E + CC40Y + CC20M Kodak Wratten No.2E | Toshiba FL20S BLB 20W: x4 |
| Reflected Ultraviolet | Kodak T-max 400 | Kodak Wratten No.18A | Toshiba FL20S BLB 20W: x4 |
| Reflected Infrared | Kodak HIE 135-36 | Kodak Wratten No.87 | Lowel V-Light 500W: x2 (3200K) |
| Infrared False Color | Kodak EIR 135-36 | Kodak Wratten No.12 + CC50C | Lowel V-Light 500W: x2 (3200K) |
*Shooting Lenses: Canon TS-E 90mm / Nikon UV 105mm
Note:
A total of 500 color sample specimens, including tempera paints, oil paints, and restoration materials, were subjected to seven different imaging techniques, resulting in the collection of 3,500 patterns of response information.
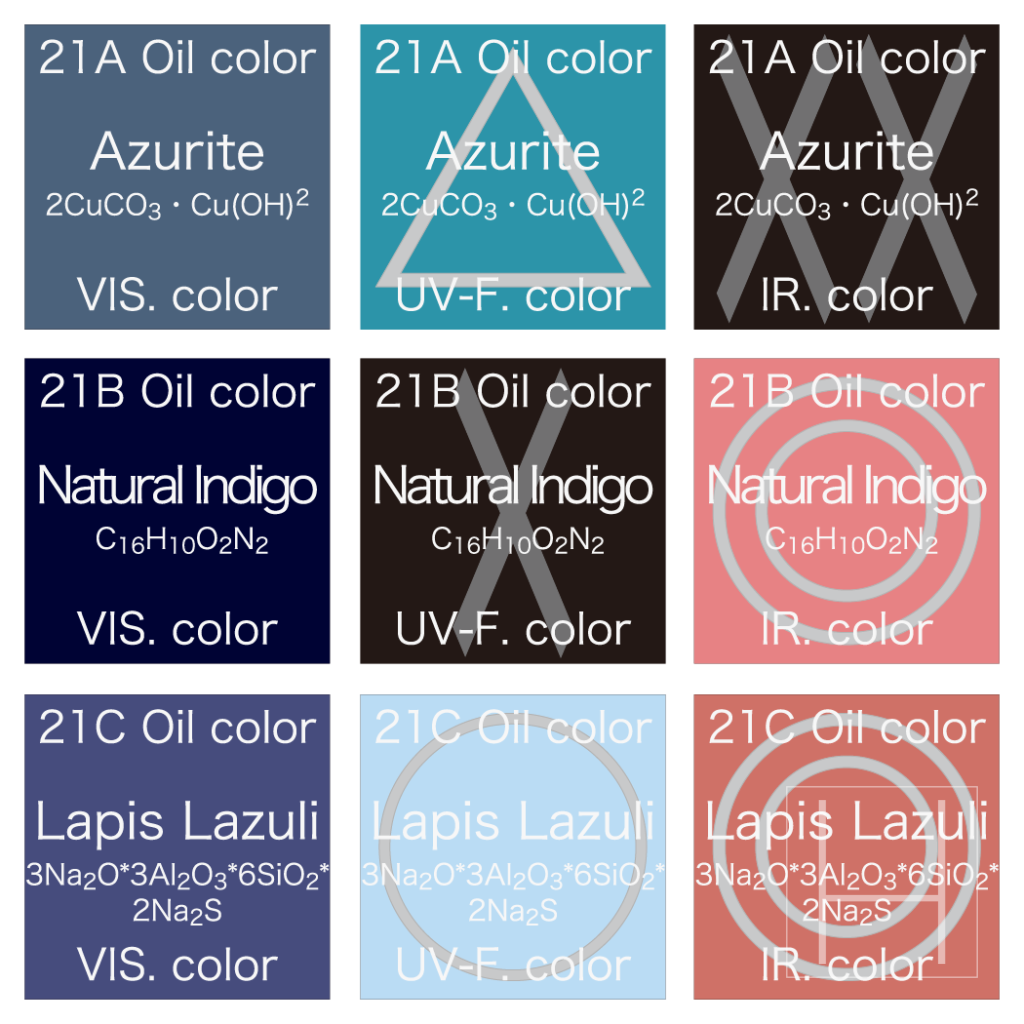
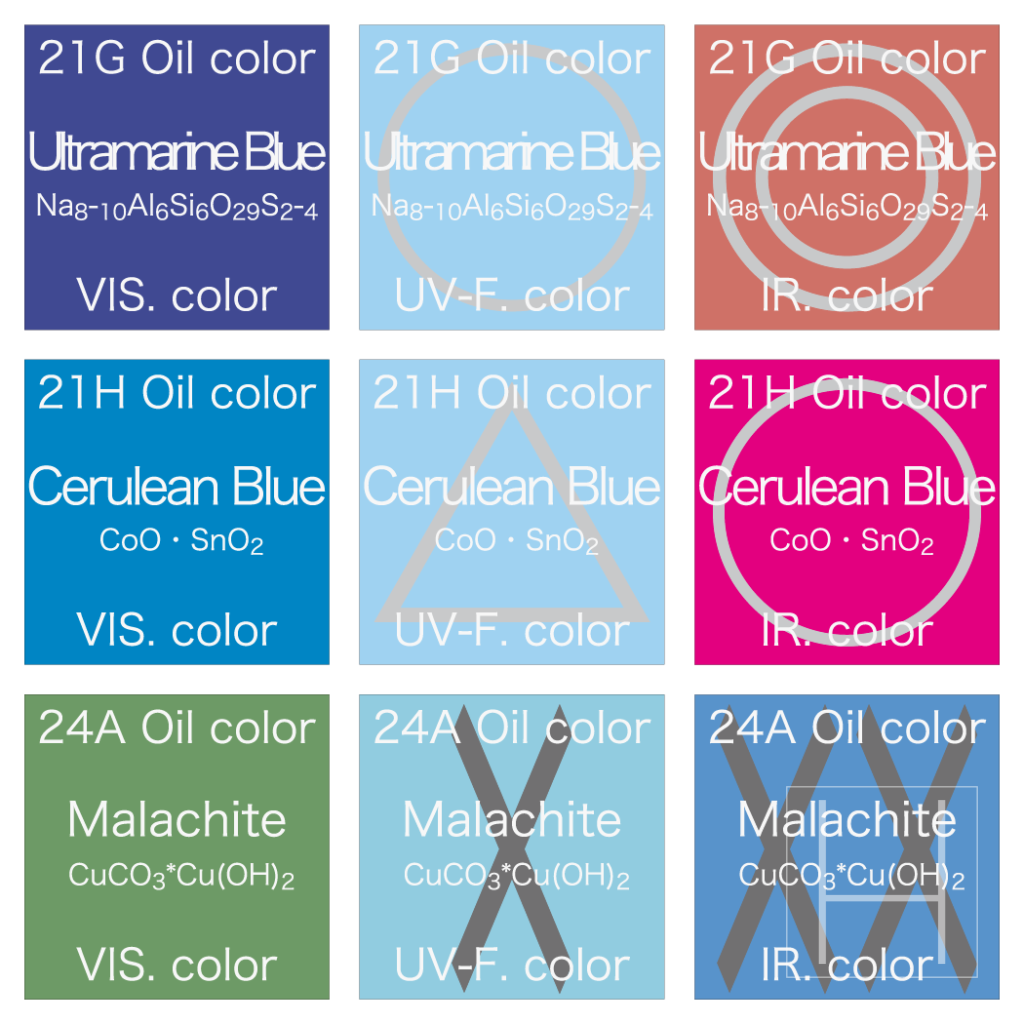
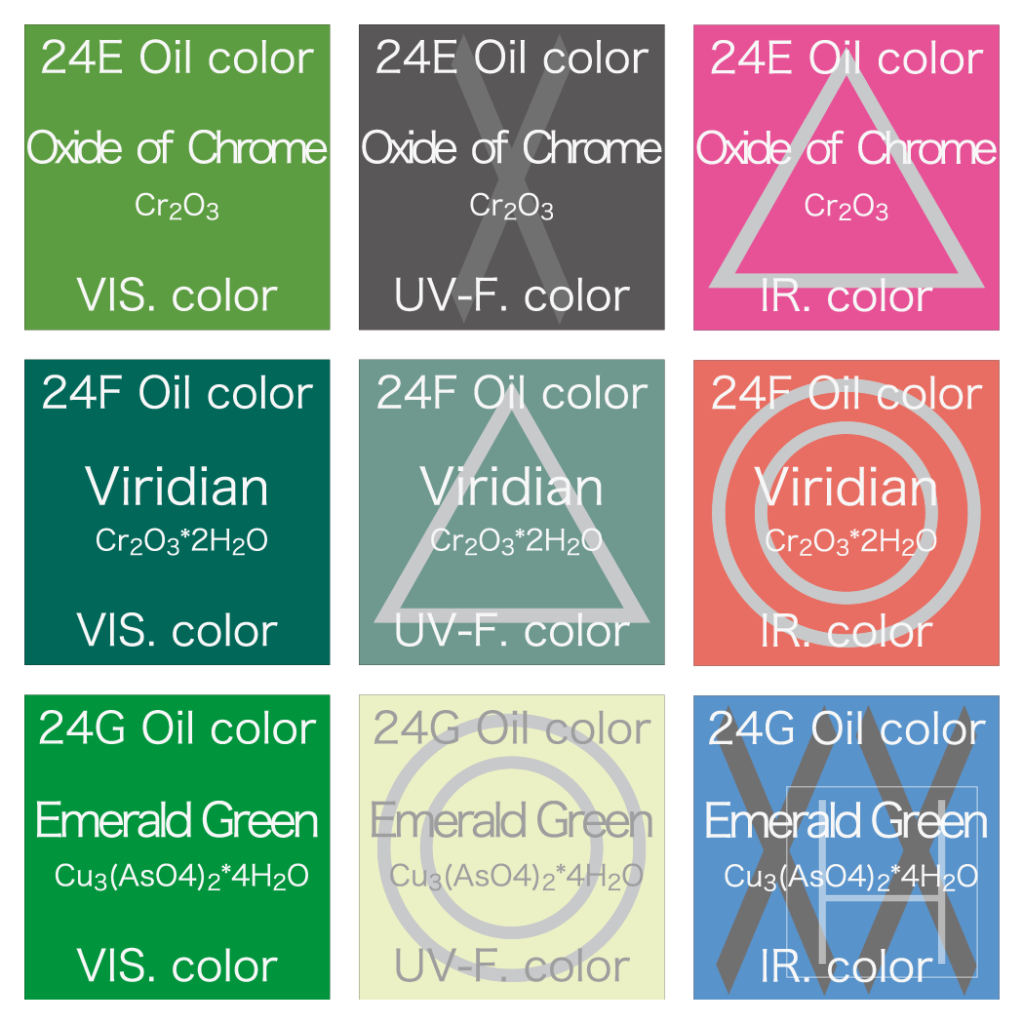
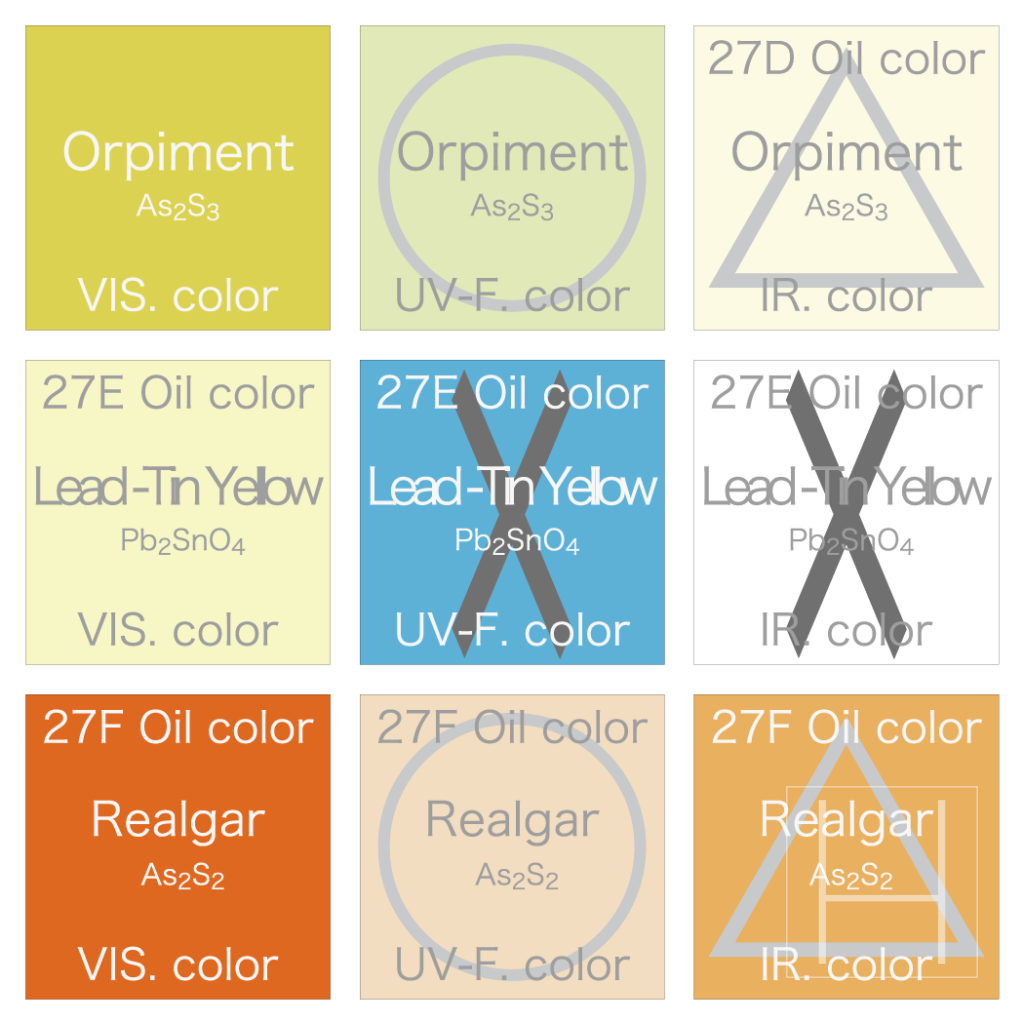
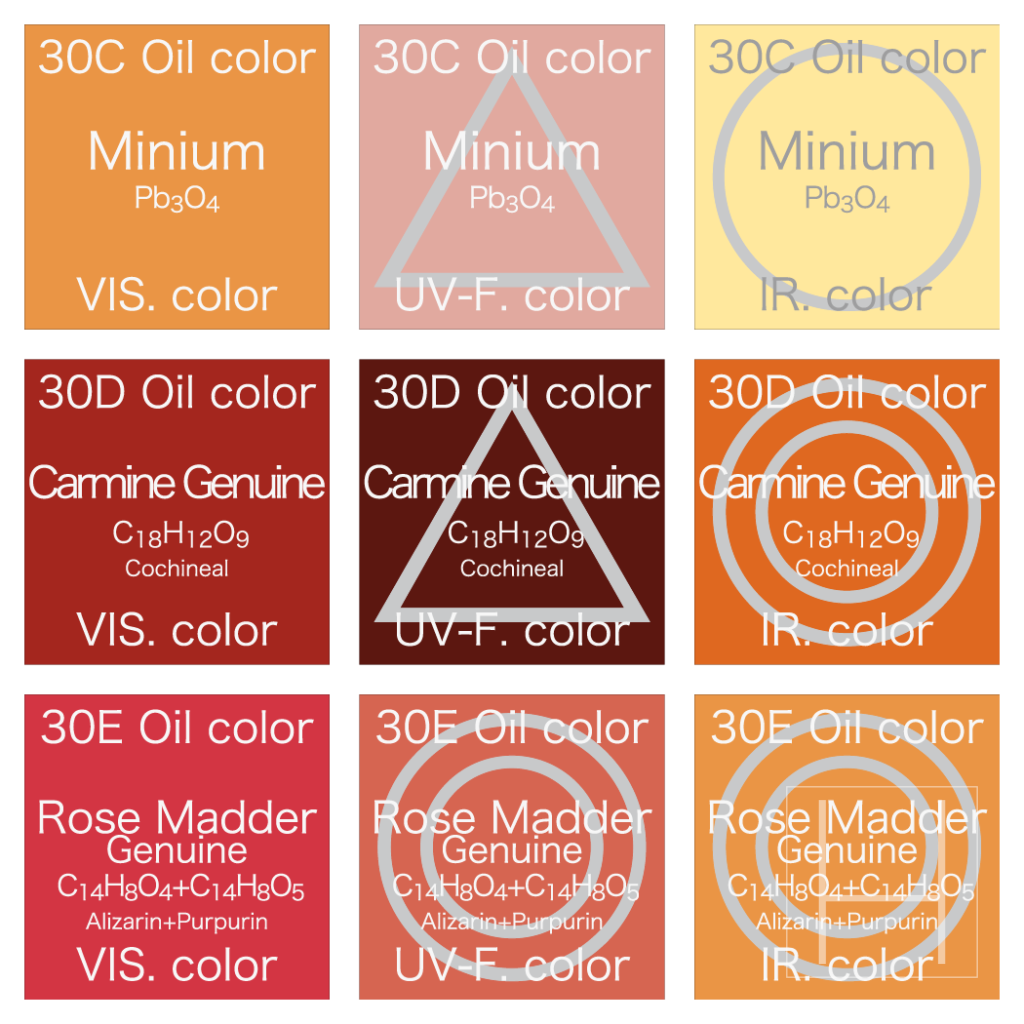
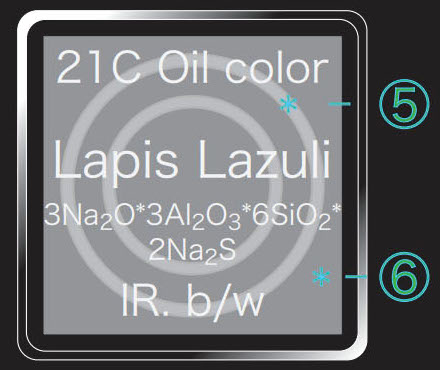
Figure 1. Sample of the reaction characteristics chart (partial view)
Two formats were created: a card format, in which each color is divided into separate pieces by reaction, and a three-dimensional format, in which all reactions are grouped into a single cube for each color.
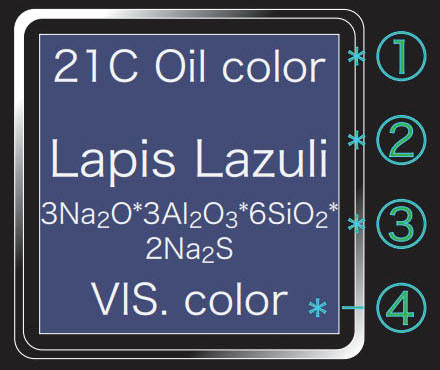
Visible Light: color
1 Color Number:Indicates the sample number from the OPD color sample reference.
2 Pigment Name:Specifies the name of the pigment.
3 Chemical Formula:Presents the chemical formula of the pigment.
4 Imaging Types::Lists the imaging methods applied to record the sample’s responses:
Visible Light: VIS. color / bw
Ultraviolet Fluorescence: UV-F. color / bw
Ultraviolet Reflectance: UV-R. bw
Infrared Reflectance: IR bw
False-Color Infrared: IR color
Infrared Reflectance b/w
5. Response Indicators:: Symbols representing the presence and intensity of reactions in each imaging type
Ultraviolet Fluorescence Reaction:
Strong ← ◎ ○ △ × ×× → Weak
Infrared Transmission/Absorption:
High Transmission ← ◎ ○ △ × ×× → High Absorption
6.Background Color:The background color reflects the sampled color or grayscale from the imaging results of each sample. For monochrome data, the grayscale intensity is used as the background color.
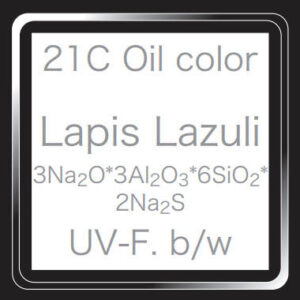
Ultraviolet Fluorescence b/w
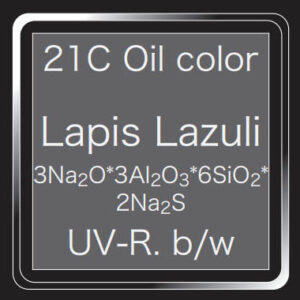
Ultraviolet Reflectance b/w
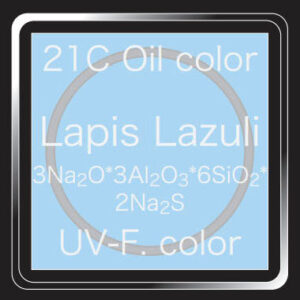
Ultraviolet Fluorescence color
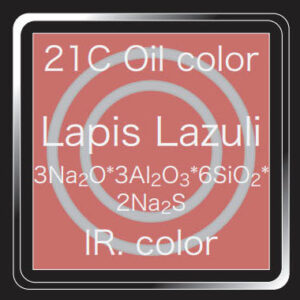
False-Color Infrared
Conclusion and Future Plans
In this study, reaction characteristics charts were prepared in both card and cube formats. However, there is room to explore new configurations that offer greater versatility. The color samples utilized in this investigation were primarily reproductions of materials from classical Italian paintings and do not encompass all modern pigments or contemporary restoration materials. To address this limitation, future efforts will focus on creating additional samples and supplementing the existing data. Moreover, it is necessary to develop reaction characteristics charts for pigment mixtures and layered patterns. Additionally, we plan to conduct ongoing studies on changes in reactions due to the aging of the color samples, as well as verify results under varying imaging conditions, including different light sources, films, filters, and digital imaging technologies.
Note on Publication jsccp.or.jp
This article is based on the research titled “Proposal of a Practical Color Chart for Optical Investigation,” presented during the poster session at the 30th Anniversary Meeting of the Japan Society for the Conservation of Cultural Property (May 24–25, 2008, Dazaifu City Central Community Center and Kyushu National Museum). It has been restructured and published by the author for non-commercial informational purposes.
References
- A. Aldrovandi, M. L. Altamura, M. T. Cianfanelli, P. Ritano, I materiali pittorici: tavolette campione per la caratterizzazione mediante analisi multispettrale, OPD Restauro, n. 8, 1996, pp. 191–210.
- R. De La Rie, Fluorescence of Paint and Varnish Layers. Part I, II, III, Studies in Conservation, vol. 27, 1982, pp. 1–7, 65–69, 102–108.
- W. Clark, Photography by Infrared, Chapman and Hall, London, 1939. Kodak, Applied Infrared Photography, Kodak Publication No. M-28, Eastman Kodak Company, Rochester, NY.
- R. Williams, G. Williams, Medical and Scientific Photography: An Online Resource for Doctors, Scientists, and Students, available at: https://www.medicalphotography.com.au/ (accessed April, 2007).
Appendix
^Appendix 1. Overview of Imaging Conditions
| Image | Applied Filter | Light Source |
| Visible light image | B+W UV/IR-CUT | Profoto Pro 5 PB head 1500W: x2 |
| Ultraviolet fluorescence image | Kodak Wratten No.12 + B+W UV/IR-CUT | Toshiba FL20S BLB 20W: x4 |
| Ultraviolet false color image | B+W UV/IR-CUT (Visible component) | Profoto Pro 5 PB head 1500W: x2 |
| Hoya U-360 (UV component) | Toshiba FL20S BLB 20W: x4 | |
| Infrared false color image | B+W UV/IR-CUT (Visible component) | Profoto Pro 5 PB head 1500W: x2 |
| Kodak Wratten No.87 (IR component) |
Kodak DCS760/ Tochighi Nikon UV 105 mm *
^Appendix 2.
This presentation was compiled in 2007, and the environment surrounding photographic technology has changed significantly since then. As an addition, I would like to explain the differences between the state of photography at the time of the presentation and the current situation, while also discussing how I plan to adapt future research to the present state of photographic technology and its environment.
At the time, photography was in a transitional period from silver-based film to digital. Digital photography was just starting to become widespread, and the resolution and image quality were still a matter of debate, especially when compared to images obtained from silver-based film unless using very expensive equipment. This was the dawn of the era when digital technology in photography was beginning to replace film, marking the end of the dominance of silver-based film in both the market and the field. Simultaneously, there were a wide variety of silver-based films available in the market, each suited for different purposes, along with various developing processes for each film type. Many labs existed to handle the necessary chemicals and processes for development. This was the peak period for silver-based film.
The reference materials consulted by the author also suggested various choices for film and developing processes. Although not mentioned explicitly, the author tested various combinations of photography techniques, development processes, and printing on photographic paper, particularly for invisible light regions, in order to achieve the best results. Today, with the development of digital equipment, the quality of results varies depending on the resolution of the equipment, and image processing has become the central focus of digital photography. However, the techniques and theories of past film development processes can still be applied.
Acknowledgements
The author would like to express gratitude to the National Institute of Information and Communications Technology (NICT) for the provision of equipment and technical support during the course of this research.
Appreciation is also extended to the Institute for Art and Restoration “L’ambiente” for their cooperation in the production of the color reference samples.
Related Pages
“Construction of Multispectral False-Color Images Using Ultraviolet-Induced Fluorescence and Reflected Ultraviolet Imaging,” by S Hamaya, 31st Annual Meeting of the JSCCP
“Proposal of a Color Reference Sample as a New Indicator for Investigative Photography,” by S Hamaya, 32nd Annual Meeting of the JSCCP